PyData NYC 2014

Written by Brenda Deverell Cortez
This year I had the opportunity to attend a couple conferences, the last one being PyData NYC 2014. The conference had a long list of incredibly interesting talks and while I am not a data scientist, it was an enriching experience to hear how they use programming do their job. Before I get into some details of what I heard about at this conference, I think it would like to share what I learned about data science.
Subscribe to our Women Who Code Newsletter to find out about similar opportunities for members in your area. Additionally, if you are a WWCode member and would like us to contact a conference near you to inquire about discounts, please email us at contact@womenwhocode.com.
Media Contact: Neal Brown | Chief of Staff Address: Women Who Code HQ, 44 Tehama St, 5th Floor San Francisco, CA 94105 Email: press@womenwhocode.com
Understanding the Meaning of “Data Science”
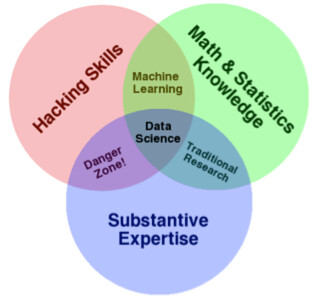
During a talk by Michael Becker titled, “Data Science: It’s Easy as Py!”, a venn diagram created by Drew Conway was shown to help the audience understand what data science really is. Dissimilar to popular belief, that data science means programming and number crunching number, the venn diagram shows that data science is interdisciplinary.
Tools for Increasing the Usability of Data Science
A theme I noticed throughout the event was the importance of making sense of data by using existing libraries, creating new programs, and avoiding front-end development at all costs. While I prefer full-stack development, I have to admit that Spyre, a Web Application Framework for providing a simple user interface for Python data projects, is pretty cool. Spyre allows data scientist to use python to do their web development without having to use JavaScript or HTML. Another interesting tool that several presenters spoke about was IPython Notebook. The IPython Notebook is a “browser-based notebook with support for code, text, mathematical expressions, inline plots and other rich media interactive tool.” This allows the user to take notes, write sample Python scripts, and execute the code directly on the document, while presenting or simply showing their notes to the world. This is the dream tool of any programming student who takes notes, but wishes he/she could run the code examples right there, instead of having to write a separate file program – maybe someone will come up with a similar tool for all languages.Talks
Overall, the talks were very technical and assumed math and statistics knowledge; however, the topics were incredibly interesting and captivating. During Manuel Rivas's talk titled, “Python for Personal and Population Genome Interpretation,” he demonstrated how to get a 23andMe data and convert it to a Variant Call Format, a special format for bioinformatics for storing gene sequence variations, and use plink/seq and additional auxiliary libraries to create DNA sequence variable annotations. Sudeep Das, from OpenTable, held a discussion titled, "“Using Data Science to Transform OpenTable Into Your Local Dining Expert.” Sudeep spoke on how OpenTable compiles user data from users' table reservations and reviews to make customized recommendations. Huy Vo led a discussion titled, “OneBusWay success, historical data to predict bus arrival.” Huy, from OneBusWay, covered items such as why the company has chosen to use OpenGL over Google Maps. OneBus collects various travel data including where people go after they arrive to their destination. For example, people who fly into La Guardia most commonly go to a hotel in midtown. Sasha Laundry, a Women Who Code Advisor and founding data scientist and engineer at Polynumeral, gave a very clever talk titled,How to Make Your Future Data Scientists Love You.I learned that it is essential to know whether your data is complete or not is essential. Additionally, knowing if the data is usable is a preliminary step to becoming involved with the data. Sasha recommended that data scientists make use of command line tools, such as csvkit and that they do quick tests on the data integrity. This was great insight for someone who is new to the field such as myself. Additional conferences that I had the opportunity to attend include: “From DataFrame to Web Application in 10 minutes,” by Adam Hajari; “Evaluating skills in education and other settings,” by Kevin Wilson; “Data-driven conversations about biology,” by Olga Botvinnik; “Grids, Streets & Pipelines: Making a linguistic street map with scikit-learn,” by Michelle Fullwood.
An Enlightening Experience
In this conference I learned that similar to data science, Python is interdisciplinary and there is a whole community is working on the intricacies within. Python is a tool for not only integration, but also for user friendliness. I think the conference was well organized, had great speakers who covered interesting topics. All topics were interesting enough, that anyone from any background could have attended. It is amazing to see and learn about what technical professionals are working on in their field. I am glad I was able to attend this conference and thank Women Who Code and PyData for the opportunity. Follow me (Brenda) on Twitter.Subscribe to our Women Who Code Newsletter to find out about similar opportunities for members in your area. Additionally, if you are a WWCode member and would like us to contact a conference near you to inquire about discounts, please email us at contact@womenwhocode.com.
Media Contact: Neal Brown | Chief of Staff Address: Women Who Code HQ, 44 Tehama St, 5th Floor San Francisco, CA 94105 Email: press@womenwhocode.com